Yearly Archives: 2015
When it comes to digital methods, one of the basic conundrums one encounters is the ambivalence between platform and practice. To phrase it in basic terms: are outcomes genuine human practice or simply artifacts of the platform’s affordances? There are different ways to approach this problem conceptually and I would go as far as saying that it is a false problem, since I do not think that there is something like unmediated human practice in the first place. The fact remains, however, that we may want to focus on one or the other for various reasons. My own interest lie squarely in understanding the technical dimension and this post introduces an approach to studying the algorithms at work in social media platforms with the help of digital methods.
While a number of scholars have recently been engaged in attempts to reverse engineer relevant algorithms, the objects I am interested in are clearly too complex and dynamic to reproduce the decision mechanisms involved – which, in any case, are probably in constant movement due to machine learning components being part of the larger procedure. My goal is actually more basic and the approach I want to present is largely descriptive in the sense that it does little more than propose a way to talk about the outcomes of algorithmic work, in this case of ranking mechanisms. By “talk about”, I first mean graphically and quantitatively, but the goal, in fact, is quite qualitative. While I have real sympathies for the desire to describe artifacts considered to be the apogee of exactness in exact terms, I think that we need to explore other directions as well. In any case, we constantly examine and analyze phenomena in ways that do not require formal descriptions. We can study the NY Times’ editorial decisions – which involve a lot of ranking and appreciation of value – in ways that do not include building a formal decision model and still make interesting observations. Maybe it is time to see how methods for describing social phenomena can be used to describe formal mechanisms and not the other way round. What I have in mind does not go very far in this direction, but it embraces description as its methodology.
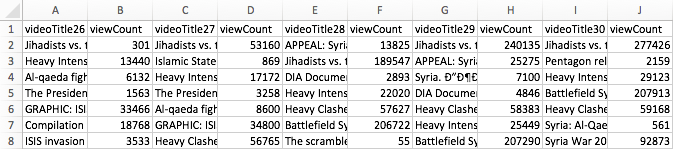
To make this idea more plastic, I take YouTube (YT) as my example and focus on YT’s search ranking. When looking for the keyword [syria], for example, YT returns an ordered list of videos. How can we talk about the produced rankings, here? One way would be to look into the factors YT itself communicates as relevant or turn to SEO blogs to gather attempts to identify the central variables. This is certainly interesting, but we could also just look at the results themselves. Using the YouTube Data Tools (YTDT), I have been collecting daily rankings for a number of keywords over the last months, [syria] being one of them. This file contains the data for five days. The rows are videos ordered by result rank and there is also a viewcount for each video. The file looks like this:
A very basic way to start making sense of these results is to visualize them. To help with this, I built a small tool, RankFlow, which is explicitly designed for analyzing rankings over time. Here is a screenshot of a visualization of the data (click for larger image):

Every column is a day of videos and each column is ordered by result rank. The height of each block encodes the viewcount variable as logarithm (to compress the vast differences in viewcount) while colors (from blue to red) indicate the unprocessed viewcount. The video with the highest viewcount actually only appears at rank 15 on the fifth day. What can we learn from such a basic visualization? First, absolute viewcount is obviously not the main ranking criterion. Second, rankings change quite a lot; between the second and the third day, for example, seven videos fall out of the top 15 and the video that comes in first on day three is again gone on day five. Third, there are a number of videos in the top ranks that have surprisingly low viewcounts. What I take from this case – and others I have looked at – is that YT probably uses a predictive ranking model that calculates something like a “chance to find an audience” metric (e.g. based on channels’ previous videos), places the video in the rankings, and – if it does not catch on – removes it again quite quickly (the top video on the first day is good example for a video that does catch on). This is in stark contrast to the “authoritative” rankings on Google Search that change much less frequently and tend towards something like a stable consensus. On YT, the ranking mechanism seems to “care” much more about quick turnover, newness, and serendipity. Looking at a simple RankFlow can give us a pretty good idea what is happening with a specific query and looking at a number of them can lead us to a more general assessment about output dynamics.
A second approach to describing ranking follows a direction that uses an algorithm to talk about another algorithm’s output. The problem with the above visualization is that it quickly gets very complicated to read and summarize when we start adding columns. But information scientists have been working on ways to produce quantitative measures to describe changes in rankings. On the bottom of the above visualization, you can see a number that tries to measure the changes between each two day pairs. There are many such measures available, but the one I found most intriguing came from a 2010 paper by William Webber, Alistair Moffat, and Justin Zobel. This was the one metric I found that would a) work with ranked lists where elements are not necessarily the same for each list (i.e. a video present on one day is no longer there on the next day), b) take into account changes in rank, not just presence or absence of an element, and c) attribute more value to changes at the top of the list than changes happening at the bottom. Rank-Biased Overlap (and its metrical form, Rank-Biased Distance) does just that. The RBD value between two days thus interprets changes in rank in a particular way and it condenses its interpretation into a single value. The higher the value, the more change. This is, of course, a reductionist gesture, but if we understand how the metric reduces, it can be extremely helpful to make sense of the “changiness” of rankings in a context where we have a lot of data. The algorithm (equation 32 in the paper, the “calc_rbo” function in my implementation) is not simple, but if you take some time to compare the visualization to the RBD values, you can get a basic feel for how it reacts to changes in rankings. This opens the door to more “macro” appreciations of changes in ranking and, interestingly, to comparison between platforms. A high average RBD value would indicate a tendency to fluctuate, a low value a preference for stability.
Both of these examples do not allow us to reverse engineer the actual algorithm(s) in question, but we need to get comfortable with the idea that this is not going to be an option in most cases anyways. Systematic description, however, allows us to still say something about the structure and dynamics of outputs and gives us an idea of the character or temperament of a ranking mechanism, for example. This post is just a starting point that I hope to turn into something more substantial in the future, but I hope it shows how relatively simple techniques can be employed to make potentially interesting findings.
When it comes to social media, YouTube is maybe the most understudied platform considering it’s enormous popularity in the context of popular culture, politics, and commerce. As part of a long term project on APIs from a software/platform studies perspective, but also in relation to the technical fieldwork required for data-driven empirical work, I have been testing the interfaces of quite a number of services now. To make this investigation productive beyond conceptual reflection, I’ve been building digital methods research tools for every system I look at. Nothing beats getting your hands dirty.
Since Google closed its search API some years ago, I haven’t really had a look at their services, but when a student of mine, Anouk Brouwer, started a thesis project on the booktube community on YouTube, I was not only fascinated by the booktube phenomenon and similar practices, but eager to revisit some older scripts and the new Data API v3 to see what kind of analyses would be possible. Google now has a centralized credential system for most of their APIs and a new quota framework where different calls cost different amounts of points. This sounds complicated, but since the quotas are extremely high (50M points/day, 3K calls/second), this is basically API dream land. After banging my head against Facebook’s technical and legal bureaucracy, it’s been extremely rewarding to work with a system that can take much, much more than I’m able to throw at it.
The outcome of this is a new set of scripts, called YouTube Data Tools (YTDT). You can try them out directly online or get the source code. For the moment, there are five modules that focus on different sections of the platform. The different features are explained in the tool interface, but I wanted to share a small experiment, made with the Channel Network module. This module starts from a set of channel ids and then crawls into the network constituted by YouTube’s featured channel feature (channels can “feature” other channels, basically just linking to them from their “channels” tab). The following image, made with gephi, shows a network of nearly 40k channels retrieved by starting with a single seed (the Vsauce channel) and crawling 7 steps into the network (click on the image for a much larger version, a PDF file is also available, as is the data):

Since a number of channels do not make their view count available, node size and color encode the number of subscribers. I’ve deleted the labels for channels with fewer than 100k subscribers for better readability and used OpenOrd for spatialization. The network is strongly clustered, in particular around practices (gaming, fashion & makeup, etc.), languages, and corporate affiliations (e.g. the Vevo and Disney empires). I wasn’t entirely aware just how many people like to watch other people play games. YouTube is obviously much bigger than this, but the map should show a sizeable portion of the upper echelons of the YouTube hierarchy.
YTDT allows for many other kinds of analysis, and I am planning to introduce them in an overview video in the hopefully not too far future. This is still an early version, but maybe already useful to some people out there.
EDIT (13/05/2015): I made an introductory video:
It’s just a quick overview, but hopefully useful as a starting point.
EDIT (23/01/2015): Changed some text to make clear that you can still run Netvizz by grabbing the source code, registering a new app, and running it in developer mode.
EDIT (25/01/2015): I have written a small install guide for the source code on github. I’m unfortunately unable to help with individual problems, if you’re unfamiliar with server administration, your department’s tech support team should be able to help.
EDIT (28/01/2015): Since Facebook has changed the way apps are created, you can apparently no longer run just scripts requiring extended permissions in newly created apps, even in developer mode (making my source code useless for you). I have therefore whipped up a version of Netvizz that can only do pages and groups without requiring extended permissions. Since this does not have to go through review, you can use the app directly here.
EDIT (29/01/2015): Facebook’s policy review has accepted the new version of Netvizz (with personal network functions removed) and the app is again accessible here. API v1.0 is still going to be retired in April and this may pose problems, but this is something for another day.
EDIT (02/05/2015): API v1.0 has now been retired, but a new version of Netvizz (v1.2) has survived the changes and should continue functioning in the foreseeable future. Personal and group friendship networks are gone for good.
Original Post:
Today Netvizz, an app that allows researchers to download data from the Facebook platform, was suspended by the company and I received a mail explaining why:
Your app is violating the following Platform Policies:
Platform Policy Section 1: Build a quality product.
Platform Policy 1.1: Build an app that is stable and easily navigable.Platform Policy 3.3: Only use friend data (including friends list) in the person’s experience in your app.
To clarify, your app should be stable and easy to use and shouldn’t stall escessively. Additionally, you should not allow friend data export, even if that data is anonymized. You can access the full list of our Platform Policies here: https://developers.facebook.com/policy/.
Since Facebook has recently been very preoccupied with app privacy – for very good reasons actually – this does not come as a surprise. I have been anticipating API changes and the retirement of version 1.0 that comes with some very sensible changes in how data is delivered to platform apps for a while. Apps are clearly one of the biggest problems when it comes to Facebook’s privacy puzzle and most changes make a lot of sense. As Bernie Hogan wrote here, friendship connections are one of the casualties, as they will no longer be available to apps at all (v2.2 no longer makes them available). I was hoping to stall a little by moving to API v2.0, which still runs until April 2016, but this seems no longer viable after this morning’s news. As much as I agree with the general changes Facebook is making, I think it is a real shame that the analytical possibilities apps like Netvizz afford will no longer be available to researchers.
Over its roughly five year life span, what started as an inquiry into Facebook’s API, ultimately had over 60K unique users and analyzing their friendship network has been the start into graph analysis for many people. GetNet, a modified version of Netvizz, was used by Lada Adamic in her highly successful Coursera MOOC, allowing students to look at a network they are intimately familiar with, making network visualization much more tangible. GetNet actually still works, but will probably break in April 2015, if not shut down earlier.
For me personally, Netvizz has been a ambivalent project. On the one side, I enjoyed the tinkering with the API, but on the other, maintaining a complex tool in my spare time has often been a challenge. As anybody who offers software online for free will tell you, the mass of not always friendly emails can be daunting. I’m also not a computer scientist and I work in a humanities department, where technical work does not really count in performance reviews.
But the real problem with the current situation has little to do with me and much more with the many courses and research projects that have been relying on Netvizz. They are left out in the cold. So here are some elements that will hopefully help them deal with the situation:
- Despite my hesitation to make software public that can be used very easily to download large amounts of non-anonymized data, there is so much code already in the wild that another set of scripts is not going to make much of a difference. I’m therefore making Netvizz’ source code publicly available.
This should allow research projects relying on Netvizz to take the source code, register their own app at developers.facebook.com and run it in developer mode (just to make this clear, since I am the developer, I can actually still run the app, but it is no longer publicly available), which should work until April 30, 2015, the day v1.0 of the API retires.I apologize for the crappy code quality, this is one of those projects that grow and grow and never get a real redesign. - I will try to enter into further communication with Facebook to see what can be done, but I don’t expect much from that.
- If that does not work, I will submit a version of Netvizz version for review that excludes personal network features and focuses on pages and groups. It’s still going to “stall excessively”, though, since it gets a lot of data.
I have no idea how long any of this make take. In the meantime, check out this list for alternatives, most of which hopefully still work. But make no mistake: this may well be the beginning of the end for external Facebook research with digital methods.