Category Archives: mathematics
“Of course, in the study of such complicated phenomena as occur in biology and sociology, the mathematical method cannot play the same role as, let us say, in physics. In all cases, but especially where the phenomena are most complicated, we must bear in mind, if we are not to lose our way in meaningless play with formulas, that the application of mathematics is significant only if the concrete phenomena have already been made the subject of a profound theory.“
A. D. Aleksandrov, A General View of Mathematics. In: A. D. Aleksandrov, A. N. Kolmogorov, M. A. Lavrent’ev, Mathematics: Its Content, Methods and Meaning. Moscow 1956 (trans. 1964)
I have recently added a new feature to the netvizz application: page like networks. This is basically a simple “like crawler” for like relationships between pages on Facebook. It starts with a seed page, gets all the pages liked by it, then gets their likes and so forth. Well, because the feature is new, I’m limiting crawl depth to two, in order to see how many resources are needed. In this post, I’ll quickly go over an example to show what one can do with this, but also to discuss a number of questions related to network analysis and visualization as such.
Network analysis and visualization (NAV) has made quite an entry into social science and humanities research circles over the last couple of years and the hype has contributed to the dominance of the network concept in new media studies and beyond. This dominance has been rightfully criticized and the pretty pictures of points and lines have received their fair share of disparaging commentary. While there are many questions and problems related to NAV, a lot of the criticism I have read or heard is superficial and lacks both understanding of the analytical gestures put forward by NAV and literacy of the diagrams one encounters so frequently now. Concerning the latter point, the main error is to consider the output of network visualization first and foremost as an image; with Barthes, I would suggest to look at them as denotative rather than connotative, as language or code more than image. This means that successful use of a network diagram requires reading skills and knowledge of the production apparatus. In their absence, well, every diagram looks likely the same.
To tease out something truly interesting from a graph – the mathematical representation of a network – a lot is needed and many, many mistakes can be made. But much like statistics, NAV is a powerful tool if handled with care. Let’s consider the following gephi diagram (data available as a .gdf file here, click for larger image):

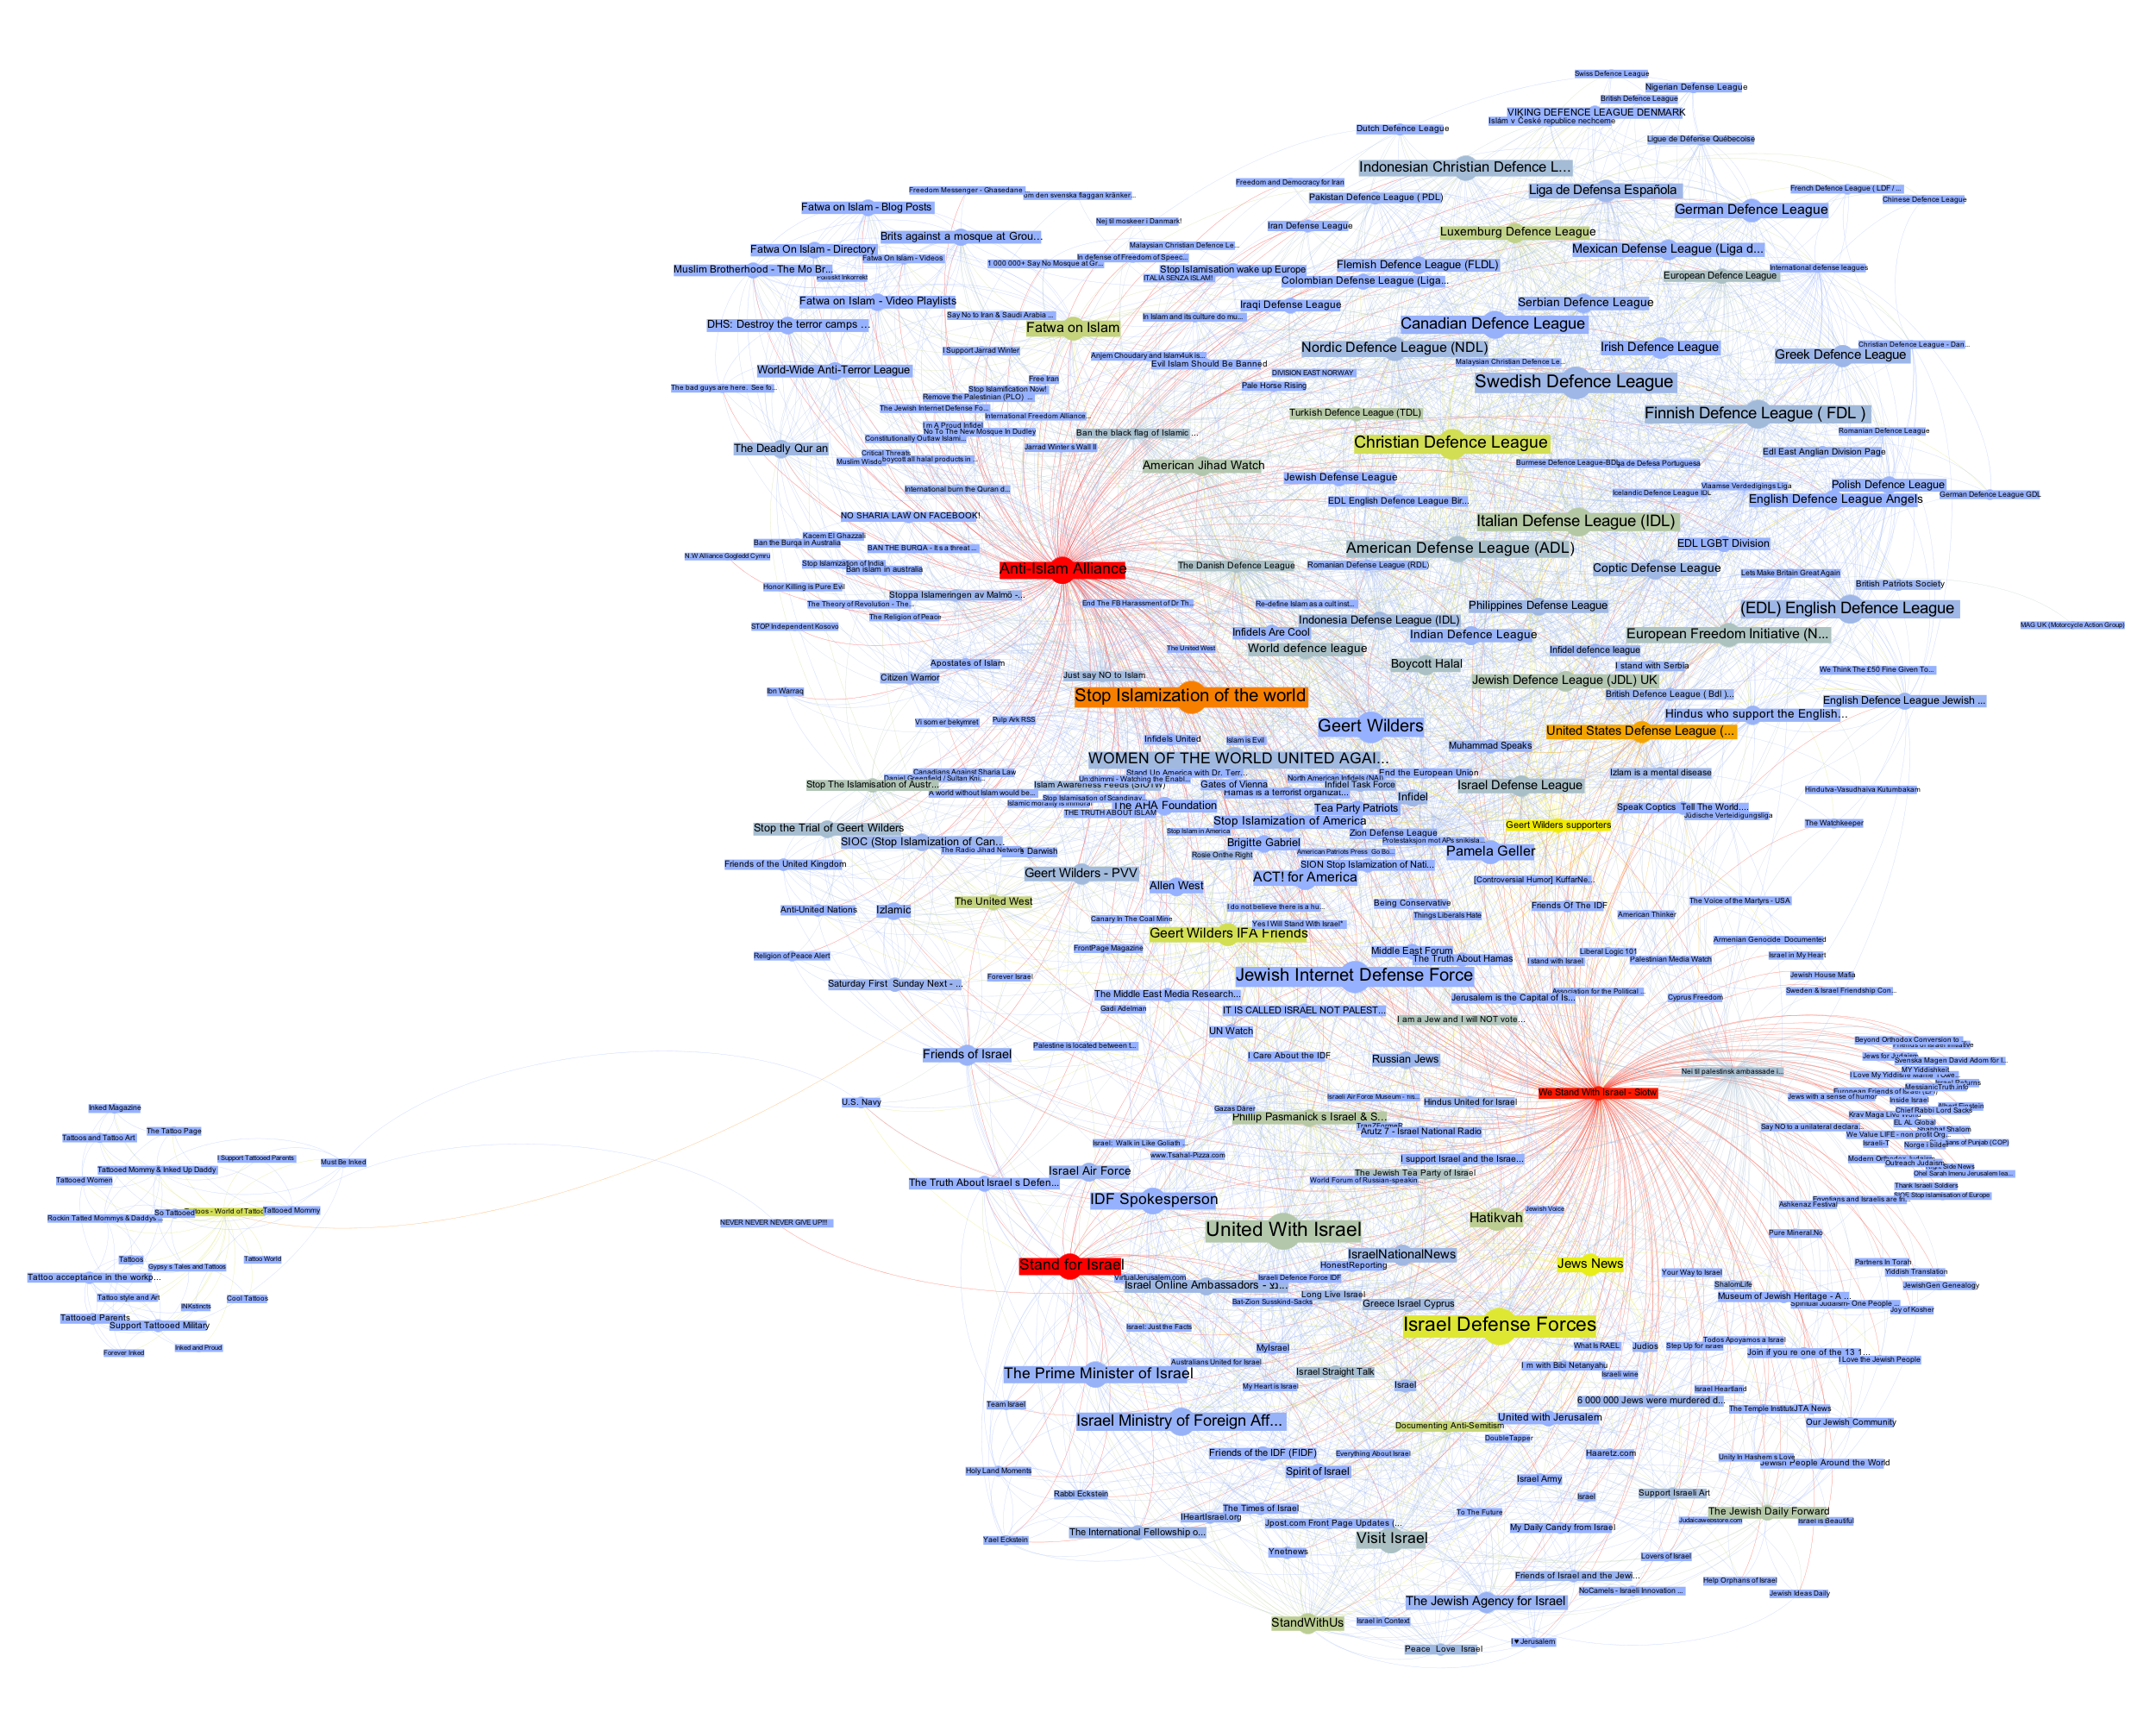
This is the visualization of a network of 370 pages on Facebook with every node a page and every link an act of “liking”. Keeping with the topic of a recent data-sprint we had with our New Media and Digital Culture MA students about Anti-Islamism, I took the “Stop Islamization of the World” page as starting point and crawled two steps into the network. The result is a quite striking web of pages that clusters – at least according to gephi’s modularity algorithm – quite neatly into four groups. In purple, we find a group of pages (122 nodes) that are explicitly focused on countering Islam; in green – and very well connected to the first group – there is a “defence league” cluster (79 nodes), basically a network of strongly islamophobic street protest groups; in red, we see a group of sites associated with Israel (145 nodes); finally, in turquoise, a much smaller and eccentric group (24 nodes) that could be called “tattoo cluster” dedicated to getting ink done. Because pages do not necessarily reciprocate liking, this is a directed graph, i.e. every link has a source and a target. The curve of the links encodes this direction: a link that bends clockwise in relation to a node is an outgoing link, counter-clockwise is incoming. In this diagram – and in all that follow – node size is a simple count of inlinks.
How does one read something like this? What does it mean? At first glance, a like crawl starting with an islamophobic page results in a large number of pages related to Israel. But what kind of entanglement is this? I think that this question cannot be answered intelligently simply by looking at a single projection of the graph as a diagram. Besides a healthy distrust of the data (why this seed? why not others? how does crawl depth affect the result? are there privacy settings in place? etc.), any non-trivial network needs to be investigated from different angles to even begin understanding its structure. As I have tried to show elsewhere, different layout algorithms flatten the n-dimensional adjacency matrix into two-dimensional diagrams in quite different ways, each bringing particular aspects of the graph structure to the foreground. But there is much more to take into account. In the above diagram, we can easily spot nodes that are bigger than others, meaning that they receive more likes. (side node: it really helps to download all images and flip through them with a decent image viewer – all networks have exactly the same size and layout, only the color changes) Can we conclude that “United with Israel” and the “Isreali Defense Forces” (both 55 inlinks) are the most important actors in this network? And what would “important” then mean? Let’s start with Google’s definition and apply PageRank to our network using a heat scale (blue => yellow => red, click for larger image):

This is quite striking. We start with an Anti-Islam page and end up with the Isreali Defense Forces as the node with the most authority. Now, as I have tried to show recently, PageRank is a complicated beast and far from a simple measure of popularity. Rather, one can think about it as a complex flow of status along links that is highly dependent on topological positioning. Who links is at least as important as the number of links – and because status is passed along, the question of who does not link is crucial. Non-random networks are generally strongly hierarchical and PageRank exploits these asymmetries to the fullest. Let’s investigate further by looking at our network in aggregate form:
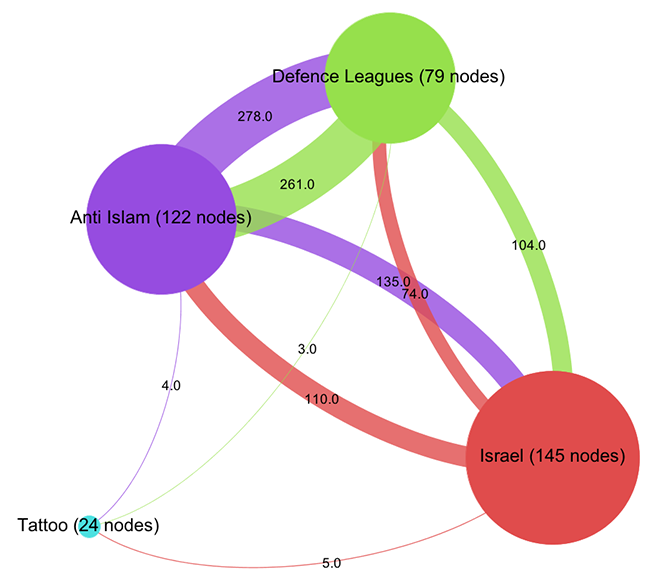
Already, a certain disequilibrium becomes visible here: while the Anti-Islam and Defence League clusters are liking back and forth in roughly equal manner, both like pages in the Israel cluster a lot more than they are liked back. But the disequilibrium is certainly not strong enough to simply diagnose a case of non-reciprocated affection. This would have been too easy. To further qualify the graph structure, we need to be able to say more about who links and who does not link. Let’s leave the force-based layout for a moment and look at the network in yet another way (click for larger image):
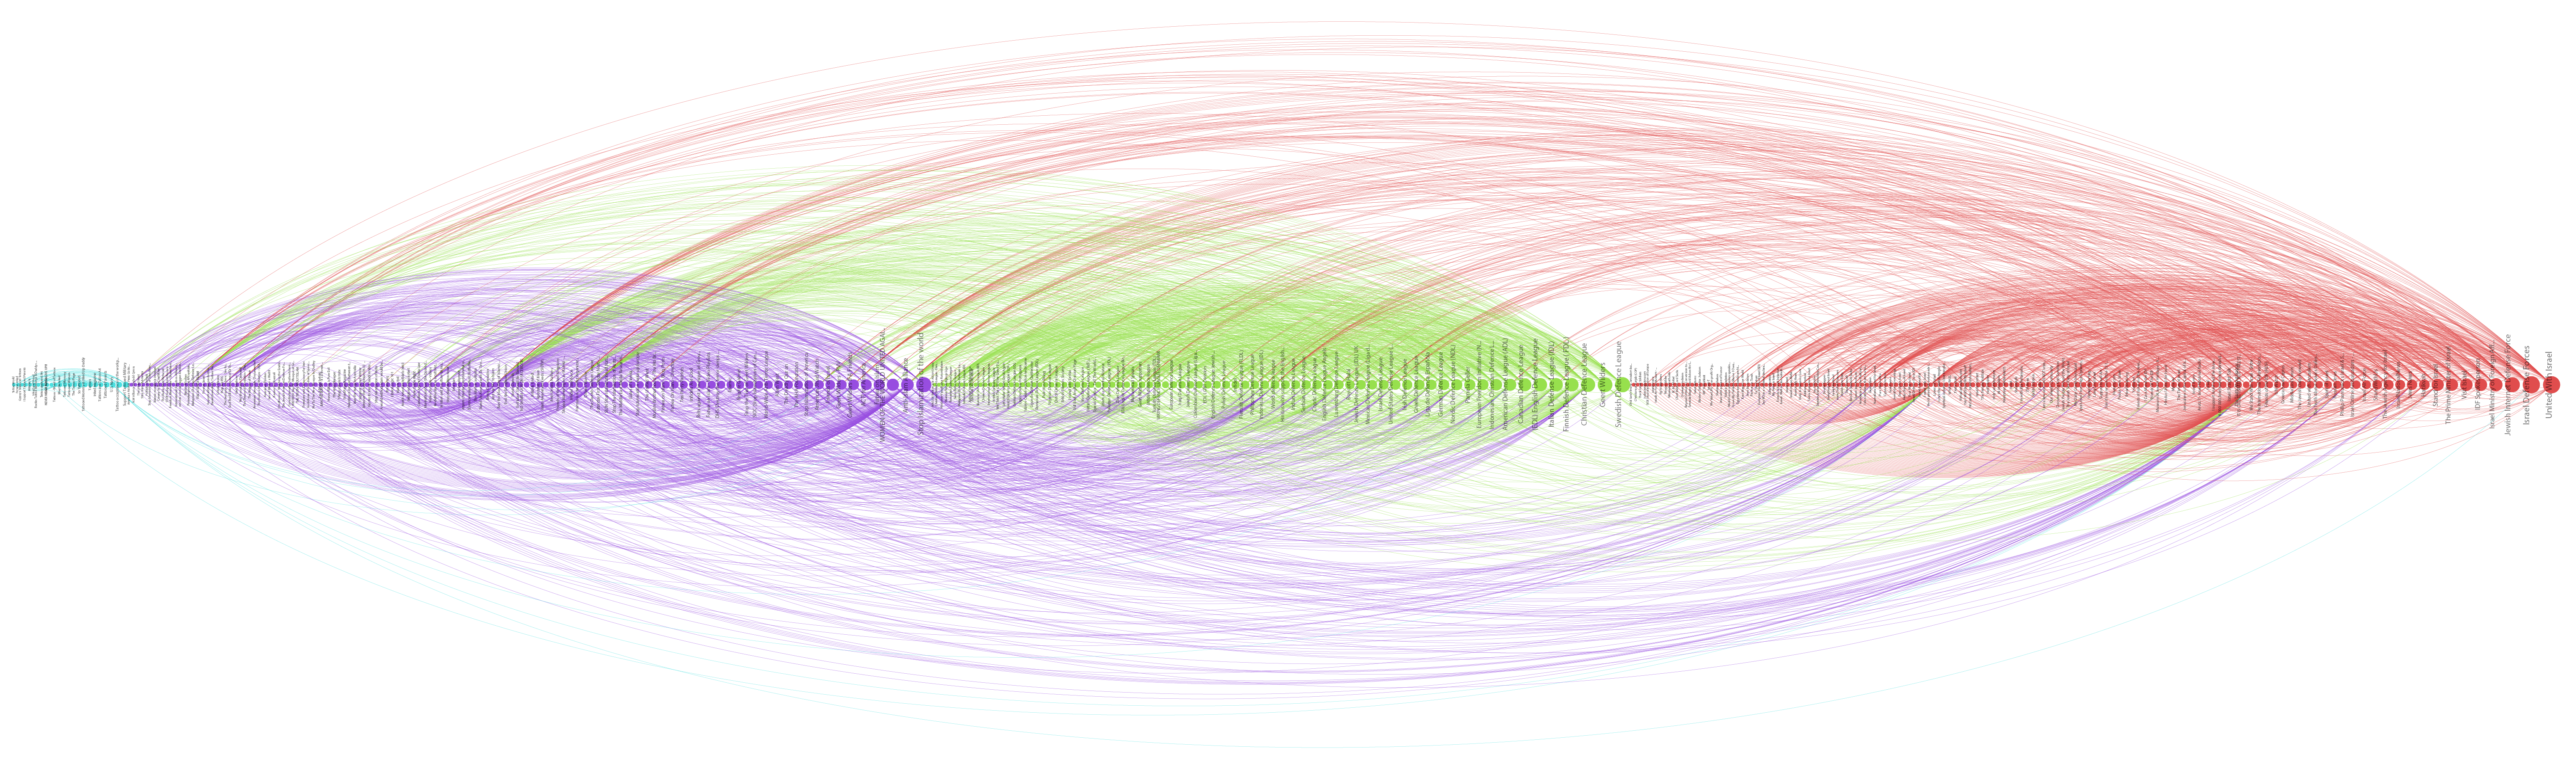
Here, I have not only arranged nodes on a line, grouped by clusters and ordered by inlink count, but I have also colored links according to their target. This means that we can very well see (on the hi-res image at least) into which cluster individual nodes are linking and even get an aggregate picture of relationships between groups. A nuanced account begins to emerge by looking at the linking practices of the top 10 pages: in the purple anti-islam cluster, page 1,2,4,6,7 and 9 link to the red israel cluster; in the green defence league cluster, 5 and 8 do so as well. But in the Israel cluster, only page 8 and 10 link to the former two. We can thus further qualify the disequilibrium mentioned above: in additional to a mere imbalance in numbers, we can observe a disequilibrium in status; high status nodes from the extremist clusters link to the Israel group, but the latter’s top pages do not like back. This explains why PageRank concentrates on the IDF page: it receives a lot of status, but does not feed it back into the network. If Facebook can stand in for the mapping of complex socio-political relationships – which it probably cannot – we could argue that the “official” Israel is clearly reluctant to associate with islamophobic extremism. But then, why is there a network in the first place? What holds it together?
Let’s start by looking at the most prolific likers in our network. The next diagram (click for larger image) shows the nodes with the highest outlink count:

Here, we see the most active likers, but we also notice that the page with the most likes (“We Stand With Israel – Siotw”) is quite small, which means that other pages do not like it very much. A better way to look at network cohesion in terms of structural positioning is thus to use a measure called betweenness centrality (click for larger image):
Betweenness centrality is often interpreted as close to the notion of bridging capital, i.e. the capacity of an actor to connect different groups. Because betweenness centrality is calculated by looking at the placement of nodes on the shortest paths in a network, it is not simply the heaviest linkers that are being put to the front here. However, some of the heavy linkers remain indeed important and if we take away “We Stand With Israel – Siotw”, a large number of the likes from the Israel cluster to the other two evaporate. The heavy linkers are indeed important for holding the network together.
But we also see the rise of a very interesting node, “Stand for Israel”. While it receives likes from apparently neutral pages such as “Visit Israel”, it is the top Israel cluster page to link into the Defence League cluster, to the “United States Defense League” page to be precise. While “Stand for Israel” announces on their page that “Violent, obscene, profane, hateful, or racist content will be deleted and offenders blocked from the page without notice” (and this indeed seems to be the case), they do like a page that is full of exactly that. That’s playing the role of a broker. In a sense, we can look at like patterns to produce actor descriptions.
What emerges through this still very superficial exploration – I made a point of not looking at the pages themselves as much as possible to focus on a pure NAV approach (which would be quite absurd in an actual research project) – is a set of rather complex relationships between pages that needs to be examined in different ways to even begin to make sense of. The diagrams, here, are not means to communicate findings, but artifacts that become truly salient only by combining, juxtaposing, and narrating them in combination. They are somehow less explanatory than in need of explanation. Let’s look at a final diagram to add yet another perspective (click for larger image):

Here, the heat scale encodes “like_count”, i.e. the number of times a page has been liked by Facebook users, not other pages. Suddenly, the picture flips completely. Albert Einstein and Tattoos lead the pack, but in the middle of the network, two nodes stand out, giving us further clues about how our clusters connect to larger political elements: “Tea Party Patriots” and “Being Conservative”.
Again, I would be very hesitant to make any claims based on the NAV of a set of Facebook pages and how they like each other, in particular in a context as sensitive as this one. Nonetheless, I hope that it becomes clear from this quick example that NAV provides means to investigate a network through multilayered and nuanced explorations of structural patterns that are simply not visible to the naked eye. And this is only a small subset of the many analytical gestures afforded by NAV. In my view, there certainly is an inflation of network diagrams and there are many limits to analyzing phenomena through formalization as points and lines. But much like the case of statistics, the often problematic use of formal techniques should not mean that we have to throw out the baby with the bathwater.
While I am still somewhat of a beginner in NAV, if there is one thing I have learned, it is that we should see network diagrams as specific projections or interpretations of the graph, as slices that interrogate data in particular ways, and that multiple such perspectives are needed to actually produce a picture.
I have started to work a bit on a forthcoming paper on the history and conceptual thrust of probabilistic indexing in Information Retrieval (“naive Bayes classifiers” for the connoisseurs) – which will also be a chapter of a forthcoming book – and while researching I stumbled over a beautiful paper. E. M. Maron, one of the central pioneers in that field, worked at the RAND corporation in the early 1960 and when not developing prototype systems that used Bayes’ theorem for “fuzzy” document scoring, he wrote memoranda on wider subjects, such as cybernetics ; “Computers and our future” is a very short piece from 1966 that is extremely lucid in terms of the questions it asks. Consider these three points about “the basic characteristics of machines [computers] and at their implications”:
- Computers operate at exceedingly high speeds. What does this imply? This means that if a high speed machine is used to control a complex situation, then it could compute an action to be taken and execute that action before a human could intervene. What are the potential dangers?
- Computers, at least at present, demand extreme precision in their instructions. They take their instructions literally. Could there be a tendency to delegate a complex decision to a machine and find out that the machine did what we asked, but that it was not what we wanted – because we ourselves did not fully comprehend the fine structure of our own instructions? What are the full implications of this?
- Computers have the capacity to handle large amounts of data. They can digest, analyze and relate these data in complete detail. If these data concern financial and personal information on people, what are the implications for the concept of privacy, for improper manipulation and control? What happens when large amounts of information about the economic and political aspects of a society are fed back to the citizens of that society? What is the influence of this information on the truth of the information? Can this type of information, when fed back, cause instabilities – economic and political? (Could the information flow – feedback, overload, and instability – be modeled?)
I would argue that these are extremely timely questions, and they show how aware at least some of the technical pioneers were in terms of the wider implications of the work they were doing. There is a tendency to caricature the cyberneticians of the 1950s and 1960s as narrow-minded taylorist technocrats, but I guess the story is more complicated after all…
Last Friday, I received an exciting present in the mail: Dénes König’s Theorie der endlichen und unendlichen Graphen from 1936, the first textbook on graph theory ever written (thank you Universitätsbibliothek der FU Berlin for not wanting it anymore). When reading the introduction, I stumbled over this beautiful quote:
Vielleicht noch mehr als der Berührung der Menschheit mit der Natur verdankt die Graphentheorie der Berührung der Menschen untereinander.
Here is my translation, although it does not do justice to the poetry of the German quote (Dativ FTW!):
Perhaps even more than to the contact between mankind and nature, graph theory owes to the contact of human beings between each other.

one of Moreno's famous sociograms
I am currently writing a paper to submit to the new and very exciting journal computational culture on the use of graph theory to produce “evaluative metrics” in contexts like Web search or social networking. One of my core arguments is going to be that the network as descriptive (mathematical) model has never stood in opposition to the notion of hierarchy but should rather be seen as a conceptual tool that was used in different fields (e.g. sociometry, psychometry, citation analysis, etc.) over the 20th century to investigate structure and, in particular, to both investigate and establish hierarchy. This finally gave me an excuse to dive into Jacob L. Moreno’s opus magnum Who Shall Survive? from 1934, which not only founded sociometry but also laid the ground work for social network analysis. This is one of the strangest books I have ever read, not only because the edition from 1978 reveals the author as a deeply Nietzschean character (“Actually, I have written two bibles, an old testament and a new testament.“), but also because the sociogenic therapy Moreno proposes as an approach to the “German-Jewish conflict” puts the whole text in a deeply saddening light. But these aspects only deepen the impression that this is a fascinating book, really one of its kind.
Interestingly, Moreno also discovered what we would now call “power-law dynamics in social networks”. One of the applications of his “sociometric test” – basically a “who do you like” type of questionnaire – in a small American town named Hudson came to the following result:
After the first phase of the sociometric test was given the analysis of the choices revealed that among a population of 435 persons,23 204, or 46.5%, remained unchosen after the 1st choice; 139, or 30%, after the 2d choice; 87, or 20%, after the 3rd choice; 74, or 17%, after the 4th choice; and 66, or 15%, after the 5th choice. (Moreno 1934, p. 249)

Moreno's comparison of distributions
This means that 15% of the population was not mentioned when the interviewees were asked which five people in the community they liked best. While this does not make for a particularly skewed distribution, Moreno transposes the result on the population of New York city and adds a quite tantalizing interpretation:
There is no question but that this phenomenon repeats itself throughout the nation, however widely the number of unchosen may vary from 1st to 5th or more choices due to the incalculable influence of sexual, racial, and other psychological currents. For New York, with a population of 7,000,000, the above percentages would be after the 1st choice, 3,200,000 individuals unchosen; after the 2nd choice, 2,100,000 unchosen; after the 3rd choice, 1,400,000 unchosen; after the 4th choice, 1,200,000 unchosen; and after the 5th choice, 1,050,000 unchosen. These calculations suggest that mankind is divided not only into races and nations, religions and states, but into socionomic divisions. There is produced a socionomic hierarchy due to the differences in attraction of particular individuals and groups for other particular individuals and groups. (Moreno 1934, p. 250f)
By looking into the history of the field, I hope to show that the observation of uneven distributions of connectivity in real-world networks, e.g. the work by Hindman and others concerning the Web, are certainly not a discovery of the “new science of networks” of recent years but a virtual constant in mathematical approaches to networks: whenever somebody starts counting, the result is an ordered list, normally with a considerable difference in value between the first and the last element. When it comes to applications of sociometry to sociology or anthropology, the question of leadership, status, influence, etc. is permanently in the forefront, especially from the 1950s onward when matrix algebra starts to allow for quick calculations of different forms of centrality. Contrary to popular myth, when Page and Brin came up with PageRank, they had a very wide variety of inspirational sources to draw from. Networks and ranking had been an old couple for quite a while already.
In August 2010, Edinburgh Sociologist Donald MacKenzie (whose book An Engine, not a Camera is an outstanding piece of scholarship) wrote an article in the Financial Times titled Unlocking the Language of Structured Securities where he discusses a software suite for financial analysis called Intex and compares it to a language that allows to see and interact with the world in certain ways rather than others. MacKenzie describes his first encounter with Intex as a moment of revelation that quickly turned into doubt:
The psychological effect was striking: for the first time, I felt I could understand mortgage-backed securities. Of course, my new-found confidence was spurious. The reliability of Intex’s output depends entirely on the validity of the user’s assumptions about prepayment, default and severity. Nevertheless, it is interesting to speculate whether some of the pre-crisis vogue for mortgage-backed securities resulted from having a system that enabled neophytes such as myself to feel they understood them.
While MacKenzie does not go as far as imputing the recent financial crisis to a piece of software, he points out that Intex is not recursive in its mode of analysis: when evaluating a complex financial asset, for example one of the now (in)famous CDOs that are made up of other assets, themselves combining further values, and so on, Intex does not follow the trail down to the basic entities (the individual mortgage) but calculates risk only from the rating of the asset in question. MacKenzie argues that Goldman-Sachs’ 2006 decision to basically get out of mortgage-based securities may well be a result of their commitment to go beyond available tools by implementing a (very costly) “bottom-up” approach that builds its evaluation of an asset by calculating up from the basic units of value. The card-house character of these financial instruments could become visible by changing tools and thereby changing perspective or language. Software makes it possible to implement very different practices or languages and to make them pervasive; but how does a company chose one strategy over another? What are the organizational and “cultural” factors that lead Goldman-Sachs to change its approach? These may be the truly challenging questions here, although they may never get answered. But they lead to a methodological lesson.
The particular strength of systems like Intex lies in their capacity to black-box evaluation strategies behind a neat interface that allows users to immediately operate on the underlying models, weaving these models into their decisions and practices. Conceptually, we understand the ways in which software shapes action better and better but the empirical complexity of concrete settings is positively daunting even outside of the realm of financial markets. What I take from MacKenzie’s work is that in order to understand the role of software, we have to be very familiar with the specific terrain a system is embedded in, instead of bringing overarching assumptions to the table. Software is a means for building structure and this building is always happening in particular organizational settings that are certainly caught up in larger trends but also full of local challenges, politics, and knowledge. Programs are at the same time structuring backdrop practice and part of a strategic repertoire that actors dispose of.
The case of financial software indicates that market behavior standardizes around available tools which leads to the systemic delegation of certain decision processes to software makers. This may result in a particular type of herd behavior and potentially in imbalance and crisis. Somewhat ironically, it is Goldman-Sachs that showed the potential of going against the grain by questioning programmed wisdom. That the company recently paid $550M in fines for abusing their analytical advantage by betting against a CDO they were selling to customers as an investment indicates that ethics and cunning are unfortunately two pair of shoes…
What is a link? From a methodology standpoint, there is no answer to that question but only the recognition that when using graph theory and associated software tools, we project certain aspects of a dataset as nodes and others as links. In my last post, I “projected” authors from the air-l list as nodes and mail-reply relationships as links. In the example below, I still use authors as nodes but links are derived from a similarity measure of a statistical analysis of each poster’s mails. Here are two gephi graphs:

If you are interested in the technique, it’s a simple similarity measure based on the vector-space model and my amateur computer scientist’s PHP implementation can be found here. The fact that the two posters who changed their “from:” text have both of their accounts close together (can you find them?) is a good indication that the algorithm is not completely botched. The words floating on the links on the right graph are the words that confer the highest value to the similarity calculation, which means that it is a word that is relatively often used by both of the linked authors while being generally rare in the whole corpus. Elis Godard and Dana Boyd for example have both written on air-l about Ron Vietti, a pastor who (rightfully?) thinks the Internet is the devil and because very few other people mentioned the holy warrior, the word “vietti” is the highest value “binder” between the two.
What is important in networks that are the result of heavily iterative processing is that the algorithms used to create them are full of parameters and changing one of these parameters just little bit may (!) have larger repercussions. In the example above I actually calculate a similarity measure between each two nodes (60^2 / 2 results) but in order to make the graph somewhat readable I inserted a threshold that boils it down to 637 links. The missing measures are not taken into account in the physics simulation that produces the layout – although they may (!) be significant. I changed the parameter a couple of times to get the graph “right”, i.e. to find a good compromise between link density for simulation and readability. But look at what happens when I grow the threshold so than only the 100 strongest similarity measures survive:

First, a couple of nodes disconnect, two binary stars form around the “from:” changers and the large component becomes a lot looser. Second, Jeremy Hunsinger looses the highest PageRank to Chris Heidelberg. Hunsinger had more links when lower similarity scores were taken into account, but when things get rough in the network world, bonding is better than bridging. What is result and what is artifact?
Most advanced algorithmic techniques are riddled with such parameters and getting a “good” result not only implies fiddling around a lot (how do I clean the text corpus, what algorithms to look for what kind of structures or dynamics, what parameters, what type of representation, here again, what parameters, and so on…) but also having implicit ideas about what kind of result would be “plausible”. The back and forth with the “algorithmic microscope” is always floating against a backdrop of “domain knowledge” and this is one of the reasons why the idea of a science based purely on data analysis is positively absurd. I believe that the key challenge is to stay clear of methodological monoculture and to articulate different approaches together whenever possible.
If we want to understand the plethora of very specific roles computers play in today’s world, the question “What is software?” is inevitable. Many different answers have been articulated from different viewpoints and different positions – creator, user, enterprise, etc. – in the networks of practices that surround digital objects. From a scholarly perspective, the question is often tied to another one, “Where does software come from?”, and is connected to a history of mathematical thought and the will/pressure/need to mechanize calculation. There we learn for example that the term “algorithm” is derived from the name of the Persian mathematician al-Khwārizmī and that in mathematical textbooks from the middle ages, the term algorism is used to denote the basic arithmetic techniques – that we now learn in grammar school – which break down e.g. the calculation of a multiplication with large numbers into a series of smaller operations. We learn first about Pascal, Babbage, and Lady Lovelace and then about Hilbert, Gödel, and Turing, about the calculation of projectile trajectories, about cryptography, the halt-problem, and the lambda calculus. The heroic history of bold pioneers driven by an uncompromising vision continues into the PC (Engelbart, Kay, the Steves, etc.) and Network (Engelbart again, Cerf, Berners-Lee, etc.) eras. These trajectories of successive invention (mixed with a sometimes exaggerated emphasis on elements from the arsenal of “identity politics”, counter-culture, hacker ethos, etc.) are an integral part for answering our twin question, but they are not enough.
A second strand of inquiry has developed in the slipstream of the monumental work by economic historian Alfred Chandler Jr. (The Visible Hand) who placed the birth of computers and software in the flux of larger developments like industrialization (and particularly the emergence of the large scale enterprise in the late 19th century), bureaucratization, (systems) management, and the general history of modern capitalism. The books by James Beniger (The Control Revolution), JoAnne Yates (Control through Communication and more recently Structuring the Information Age), James W. Cortada (most notably The Digital Hand in three Volumes), and others deepened the economic perspective while Paul N. Edwards’ Closed World or Jon Agar’s The Government Machine look more closely at the entanglements between computers and government (bureaucracy). While these works supply a much needed corrective to the heroic accounts mentioned above, they rarely go beyond the 1960s and do not aim at understanding the specifics of computer technology and software beyond their capacity to increase efficiency and control in information-rich settings (I have not yet read Martin Campell-Kelly’s From Airline Reservations to Sonic the Hedgehog, the title is a downer but I’m really curious about the book).
Lev Manovich’s Language of New Media is perhaps the most visible work of a third “school”, where computers (equipped with GUIs) are seen as media born from cinema and other analogue technologies of representation (remember Computers as Theatre?). Clustering around an illustrious theoretical neighborhood populated by McLuhan, Metz, Barthes, and many others, these works used to dominate the “XY studies” landscape of the 90s and early 00s before all the excitement went to Web 2.0, participation, amateur culture, and so on. This last group could be seen as a fourth strand but people like Clay Shirky and Yochai Benkler focus so strongly on discontinuity that the question of historical filiation is simply not relevant to their intellectual project. History is there to be baffled by both present and future.
This list could go on, but I do not want to simply inventory work on computers and software but to make the following point: there is a pronounced difference between the questions “What is software?” and “What is today’s software?”. While the first one is relevant to computational theory, software engineering, analytical philosophy, and (curiously) cognitive science, there is no direct line from universal Turing machines to our particular landscape with the millions of specific programs written every year. Digital technology is so ubiquitous that the history of computing is caught up with nearly every aspect of the development of western societies over the last 150 years. Bureaucratization, mass-communication, globalization, artistic avant-garde movements, transformations in the organization of labor, expert movements in public administrations, big science, library classifications, the emergence of statistics, minority struggles, two world wars and too many smaller conflicts to count, accounting procedures, stock markets and the financial crisis, politics from fascism to participatory democracy,… – all of these elements can be examined in connection with computing, shaping the tools and being shaped by them in return. I am starting to believe that for the humanities scholar or the social scientist the question “What is software?” is only slightly less daunting than “What is culture?” or “What is society?”. One thing seems sure: we can no longer pretend to answer the latter two questions without bumping into the first one. The problem for the author, then, becomes to choose the relevant strands, to untangle the mess.
In my view, there is a case to be made for a closer look at the role the library and information sciences played in the development of contemporary software techniques, most obviously on the Internet, by not exclusively. While Bush’s Memex has perhaps been commented on somewhat beyond its actual relevance, the work done by people such as Eugene Garfield (citation analysis), Calvin M. Mooers (information retrieval), Hans-Peter Luhn (KWIC), Edgar Codd (relational database) or Gerard Salton (the vector space model) from the 1950s on has not been worked on much outside of specialist circles – despite the fact that our current ways of working with information (yes, this includes your Facebook profile, everything Google is doing, cloud computing, mobile applications and all the other cool stuff Wired writes about) have left behind the logic of the library catalog quite some time ago. This is also where today’s software comes from.
Over the last year, I have been reading loads of books in and on Information Science, paying special attention to key texts in the (pre)history of the discipline. Fritz Machlup and Una Mansfield’s monumental anthology The Study of Information (Wiley & Sons, 1983) has been a pleasure to read and there are several passages in the foreword that merit a little commentary. I have always wondered why Shannon’s Mathematical Theory of Communication from 1948 has been such a reference point in the discipline I started out in, communication science. Talking about purely technological problems and pumped with formulas than very, very few social science scholars could make sense of, the whole things seems like a misunderstanding. The simplicity and clearness of the schema on page two – which has been built into the canonical sender-receiver model – cannot be the only reason for the exceptional (mostly second or third hand) reception the text has enjoyed. In Machlup & Mansfield’s foreword one can find some strong words on the question of why a work on engineering problems that excludes even the slightest reference to matters of human understanding came to be cited in probably every single introduction to communication science:
“When scholars were chiefly interested in cognitive information, why did they accept a supposedly scientific definition of ‘information apart from meaning’? One possible explanation is the fact that they were impressed by a definition that provided for measurement. To be sure, measurement was needed for the engineering purposes at hand; but how could anybody believe that Shannon’s formula would also measure information in the sense of what one person tells another by word of mouth, in writing, or in print?
We suspect that the failure to find, and perhaps impossibility of finding, any ways of measuring information in this ordinary sense has induced many to accept measurable signal transmission, channel capacity, or selection rate, misnamed amount of information, as a substitute or proxy for information. The impressive slogan, coined by Lord Kelvin, that ‘science is measurement’ has persuaded many researchers who were anxious to qualify as scientists to start measuring things that cannot be measured. As if under a compulsion, they looked for an operational definition of some aspect of communication or information that stipulated quantifiable operations. Shannon’s formula did exactly that; here was something related to information that was objectively measurable. Many users of the definition were smart enough to realize that the proposed measure – perfectly suited for electrical engineering and telecommunication – did not really fit their purposes; but the compulsion to measure was stronger than their courage to admit that they were not operating sensibly.” (p. 52)
For Machlup & Manfield – who, as trained (neoclassical) economists, should not be deemed closet postmodernists – this compulsion to measure is connected to implicit hierarchies in academia where mathematical rationality reigns supreme. A couple of pages further, the authors’ judgment becomes particularly harsh:
“This extension of information theory, as developed for communication engineering, to other quite different fields has been a methodological disaster – though the overenthusiastic extenders did not see it, and some of them, who now know that it was an aberration, still believe that they have learned a great deal from it. In actual fact, the theory of signal transmission or activating impulses has little or nothing to teach that could be extended of applied to human communication, social behavior, or psychology, theoretical or experimental.” (p. 56)
Shannon himself avoided the term “information theory” and his conception of communication obviously had nothing to do with what the term has come to mean in the social sciences and general discourse. But the need to show that the social sciences could be “real” sciences in search of laws formulated in mathematical terms proved stronger than the somewhat obvious epistemological mismatch.
Like many classic texts, Machlup & Manfield’s work offers a critique that is not based on dismissal or handbag relativism but on deep engagement with the complexities of the subject matter and long experience with interdisciplinary work, which, necessarily, makes one bump into unfamiliar concepts, methods, ontological preconceptions, modes of reasoning, vectors of explanation and epistemological urges (what is your knowledge itch? how do you want to scratch it?). The Study of Information is a pleasure to read because it brings together very different fields without proposing some kind of unifying meta-concept or imperialist definition of what science – the quest for knowledge – should look like.
The question of how mathematics could lay the foundation for a machine that sustains such a wide variety of practices is really quite well understood from the point of view of the mathematical theory of computation. From a humanities standpoint however, despite the number of texts commenting on the genius of key figures such as Gödel, Turing, Shannon, and Church, there is still a certain awkwardness when it comes to situating the key steps in mathematical reasoning that lead up to the birth of the computer in the larger context of mathematics itself. One of the questions I find really quite interesting is the role of the formalist stance in mathematics.
In the philosophy of mathematics, there are many different positions. The realist stance for example holds that mathematical objects exist. For the platonist, they exist in some kind of extra spatio-temporal realm of ideas. For the physicalist, they are intrinsically connected to material existence, even if that relationship is not necessarily simple. Then there is formalism and this is where things get interesting. In a tale we can read in many social sciences and humanities books on the computer, there is the young Kurt Gödel that smashes the coherent world of the “establishment” mathematician David Hilbert, inventing the metamathematical tools that will later prove essential for the practical realization of computing machinery in the process. What is most often overlooked in that story is that Hilbert’s formalist position is already an extremely important step in the preparation for what is to come. For Hilbert, the question of the ontological status of mathematical objects is already a no-go – truth is no longer defined via any kind of correspondence to an external system but as a function of the internal coherence of the symbolic system. As Bettina Heintz says, Hilbert’s work rendered mathematical concepts “self-sufficient” (autark) by liberating them from any kind of external benchmark and opening a purely mechanical world where symbolic machinery can be built at will, like in a game.
If we want to think about computing today, I think we should remember this break from an ontological concept of truth to a purely formalistic one (even if that mean Gödel put a pretty big crack in it lateron). Because in a way, programming is like a “game” with formulas and if the algorithm works, that means it is “true”. In this sense, Google’s PageRank algorithm is true. But without the reference to an external system, this “truth” is purely mechanical, internal. In a similar way, an algorithm’s claim to objectivity, impartiality, or neutrality should be seen as internal only. The moment we apply mathematics to the description of some external mechanism (gravity, for example), there is a second truth criterion that intervenes, which refers to the establishment of correspondence between the formal system and the external reality. In the same way, if an algorithm is applied to, let’s say the filtering of information, the formal world of the game is mapped onto another world. There is an important difference however. When mathematics are applied to physical phenomena, the gesture is descriptive and epistemological (verb: is). When an algorithms is applied to tasks such as information filtering, the gesture is prescriptive and political (verb: ought).
The fact than an automatic procedure works makes it true in a formal sense. The moment we apply it to a certain task, other criteria intervene. Hilbert’s formalism pulled mathematics from the empirical world and if we bring the two together again by writing software, the criteria by which we judge the quality of that action should be seen as political because there are no mathematical criteria to judge the mapping of on world onto the other. No Hilbert to hold our hand…